Solved
Marketing Channels & Visualizations
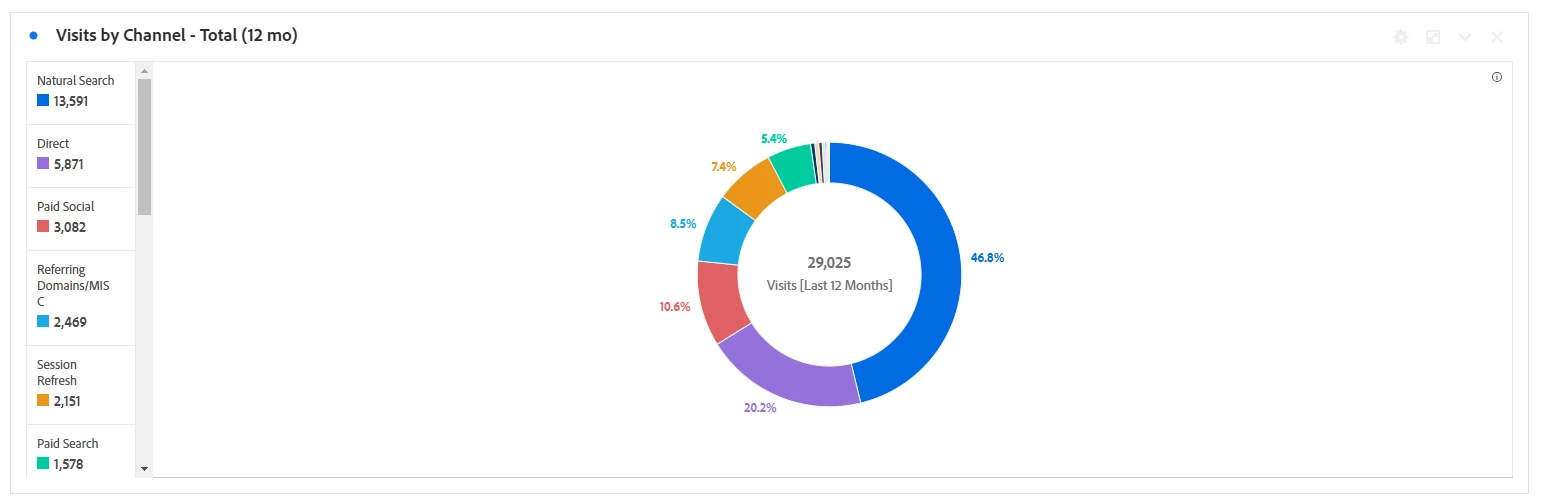
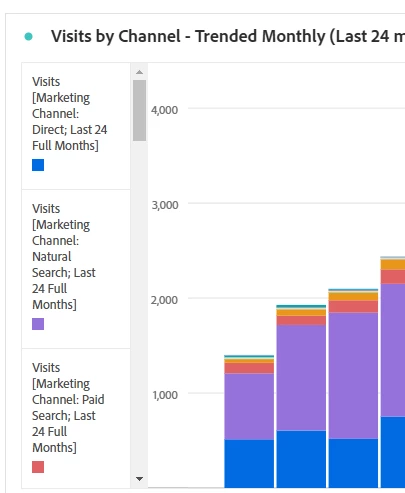
Hi! I am working on dashboards for my marketing organization. I run into issues while creating different visualizations based on marketing channel data. For example, in the below donut chart, Natural Search is blue due to it having the highest volume of visits. However, when I create a bar chart that shows visits x channel x month, Direct is blue because of how the freeform table has to be set up for that specific visualization. This can be pretty confusing for my team members who use this reporting. Is there a way to lock the order of these channels so that no matter what page/date range users are looking at the marketing channel legends stay aligned?