Solved
Line Charts Showing Grand Totals Instead of Filtered Channel Data (Linear Attribution)
- January 2, 2025
- 3 replies
- 1345 views
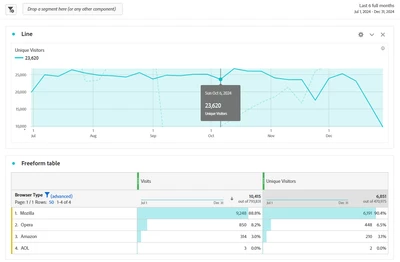
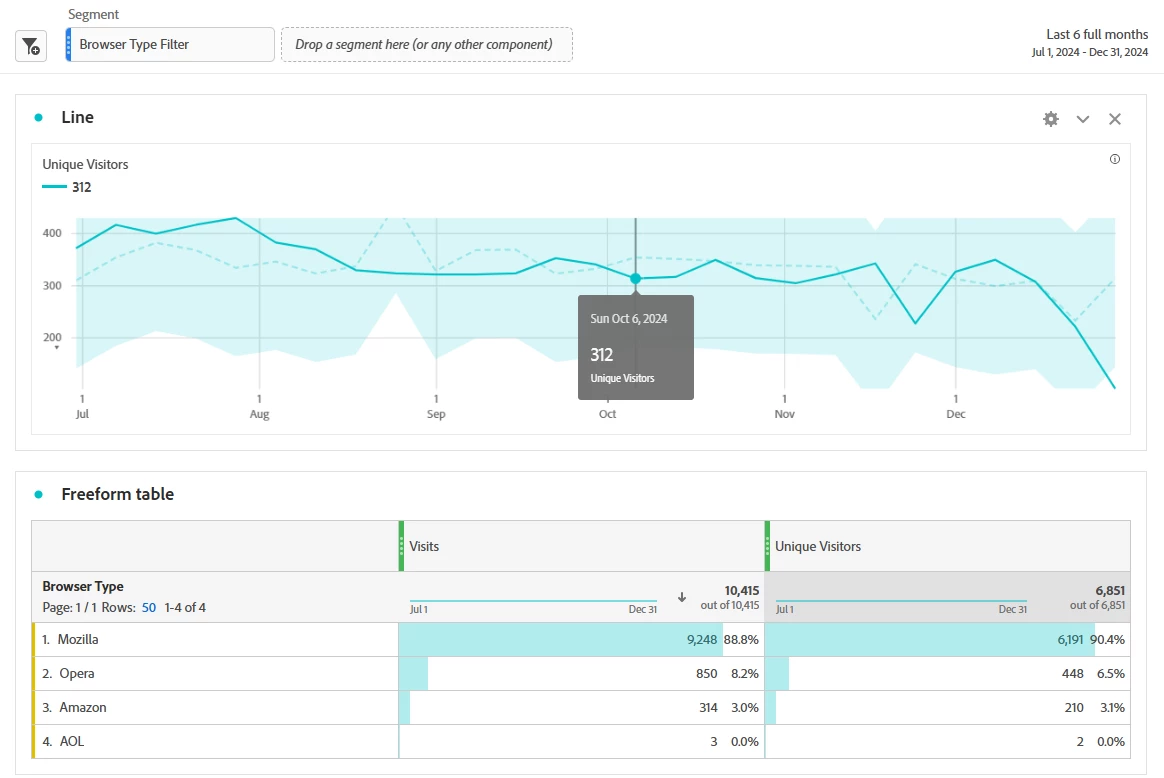
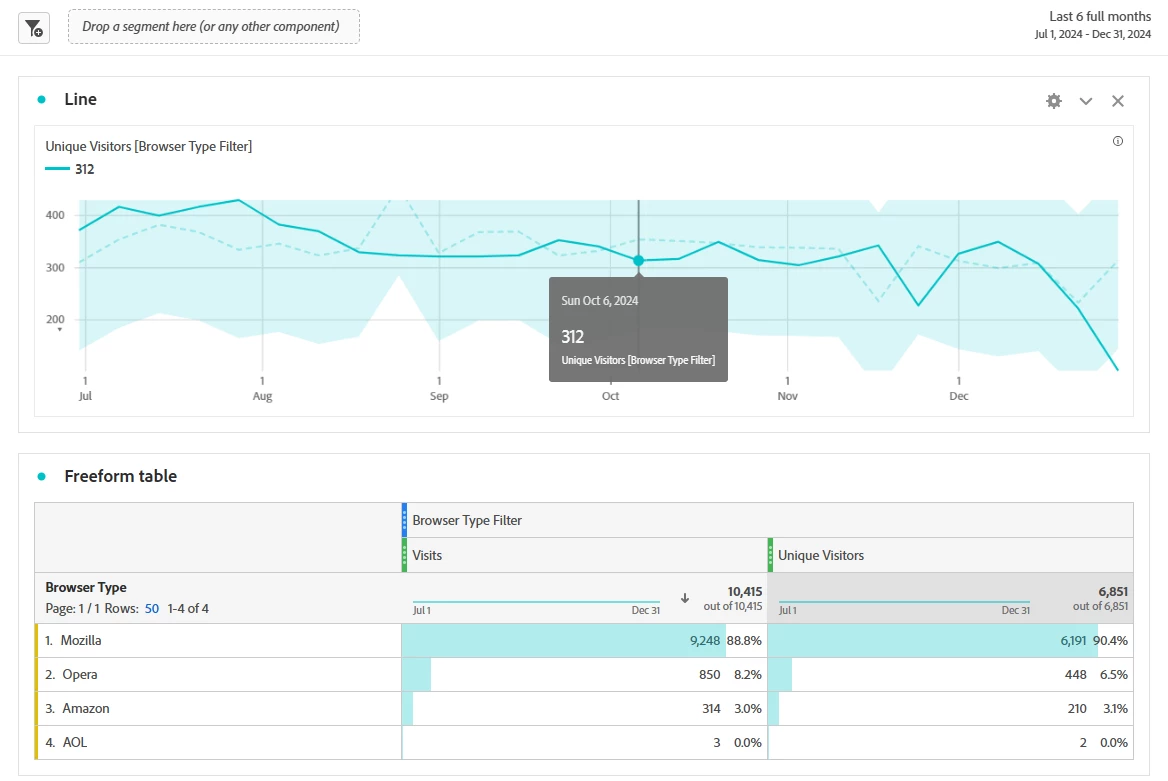
In Adobe Analytics, we need a line chart that shows the monthly trend for specific marketing channels (filtered totals). However, using a 90-day linear attribution model and applying segmentation still results in a chart displaying the grand total across all channels, even those excluded by the filter. This forces us to export data to Excel for accurate charting, which is inefficient. Is there a way to configure Adobe Analytics to correctly display filtered channel totals in a line chart?