Image Request URL not containing any data | Community
Skip to main content
Level 2
April 17, 2023
Solved

Image Request URL not containing any data

  • April 17, 2023
  • 2 replies
  • 2722 views

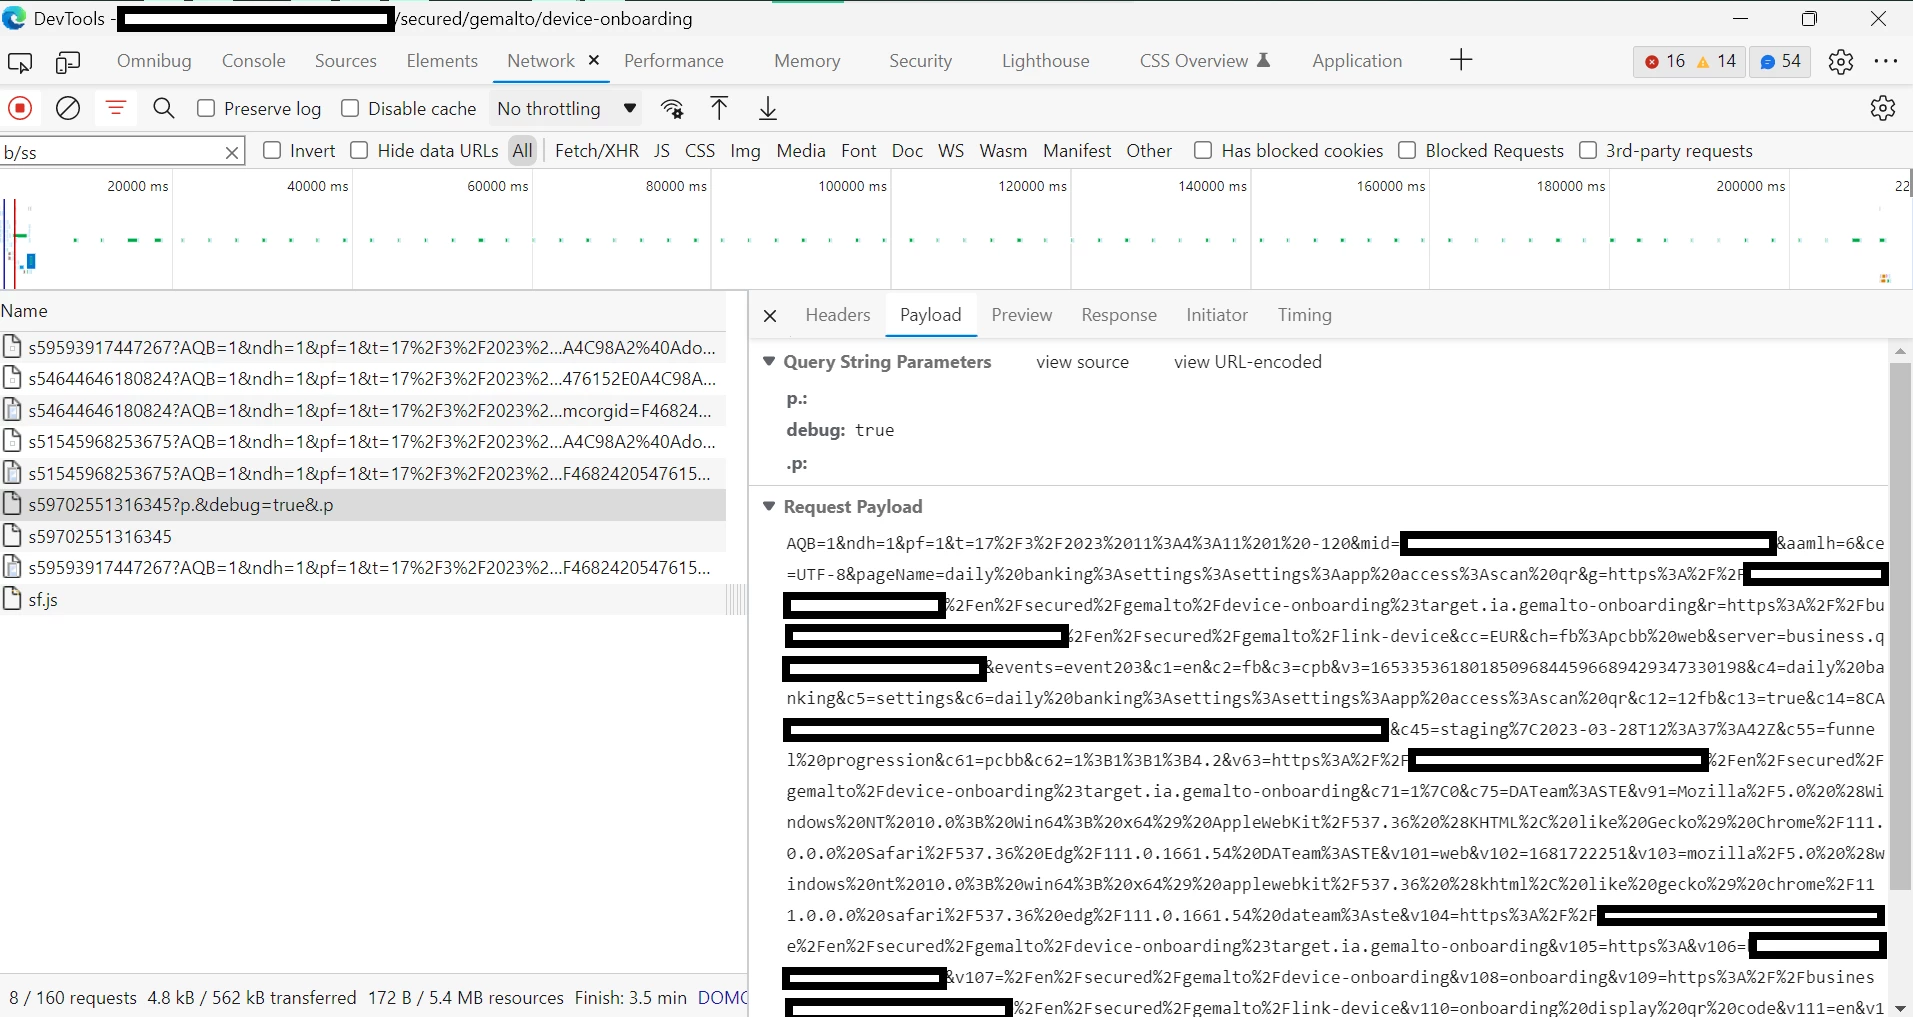
In my organization, there is one specific funnel which is missing all data from the steps on web. The server call (custom link) is visible in Adobe Exp Platform Debugger, Omnibug and the extension Debugger for Adobe Analytics, and has 200 status on the network tab. All the eVars & props that should be there are there on all three of these debuggers. However, the Image Request URL for the server call is missing all of this data. The query string is limited to "?p.&debug=true&.p" whereas for the other server calls, the string contains all the prop and evar values. When looking at the related call on the network tab, I see 2 tabs under "payload", the first being "Query String Parameters" and the second being "Request Payload". The "request payload" string contains all the data, but this data is not in the query string parameters and is therefore not delivered to AA. See screenshot below. Any suggestions for why this is happening would be appreciated. Feel free to request more information. Thank you.


This post is no longer active and is closed to new replies. Need help? Start a new post to ask your question.
Best answer by TetikelSarp

Sorry for the delayed response everyone. I appreciate your suggestions and it turns out that the issue was caused by a missing "if" statement in the processing rules that overwrites the value of the eVar with data coming from the mobile app, i.e., overwrite value of eVar123 with contextData. All I had to do was add an "if" that said "if contextData exists". A very simple fix that was surprisingly overlooked by a lot of the people I work with. 😃 

2 replies

yuhuisg
Community Advisor
Community Advisor
April 17, 2023

What you're seeing is correct, actually, and your data as shown in the Request Payload screen should be reflected in your AA report.

Browsers generally send data to servers via GET or POST network requests. (There are other types, but these are two main ones.) GET requests are the ones where you can see the query string parameters in the URL. POST requests are where you can't, because the data is normally sent in a "payload". POST is commonly used for sending form data, which can't be all included in the query string parameters.

GET requests have a limit on the amount of data that can be sent in them. Different browsers have different limits, but it's usually a few kilobytes of data. So if a GET request is used to send more data than is allowed within the limit, then the browser fails to send the GET request. Obviously, that's bad for tracking. So AA uses POST requests to send beacons that have a lot of data to track, and that's when you see the Request Payload screen.

Unfortunately, the AEP Debugger is not able to show the data in Request Payloads. It really only shows the data in query string parameters only. That means it can show the hits from GET requests with query string parameters for all of your tracked data. But when AA sends the beacon with the POST requests, then the AEP Debugger is not able to show the data in the Request Payload. (You can normally see this happen with Download and Exit Links that are tracked automatically.)

As mentioned at the start, your tracked data from both GET and POST requests should be captured properly by AA nonetheless, and so your reports should be correct. If you're not seeing data, then it could be because there is some tracked data from the POST requests that is not recognised by AA, and so the entire Request Payload is rejected. In that case, you'll need to investigate the data that you're tracking to ensure that you're tracking valid values (normally text strings or numbers only).

Jennifer_Dungan
Community Advisor and Adobe Champion
April 17, 2023

@yuhuisg has covered this really well, but I will add one thing... using GET vs POST method is a normal part of Adobe's processing... if the URL string is under 2000 characters, it uses GET... if it's over 2000 characters it uses POST.


Both are completely valid ways for the data to get to Adobe.


I am not sure what yuhuisg means by "Unfortunately, the AEP Debugger is not able to show the data in Request Payloads." The tool does show the POST requests Payloads... more than half my requests use the POST method, and all the data is shown in the debugger.... If it didn't I would always have to extract that manually and manipulate the string to read it.....

yuhuisg
Community Advisor
Community Advisor
April 18, 2023

@jennifer_dungan wrote:

I am not sure what yuhuisg means by "Unfortunately, the AEP Debugger is not able to show the data in Request Payloads." The tool does show the POST requests Payloads... more than half my requests use the POST method, and all the data is shown in the debugger.... If it didn't I would always have to extract that manually and manipulate the string to read it.....


You're right, I see that now. I remember not being able to see POST requests' data (e.g. eVars, props, etc) in the Debugger, could only see a new column added to the Analytics hits with basic info about the network request.

TetikelSarpAuthorAccepted solution
Level 2
May 10, 2023

Sorry for the delayed response everyone. I appreciate your suggestions and it turns out that the issue was caused by a missing "if" statement in the processing rules that overwrites the value of the eVar with data coming from the mobile app, i.e., overwrite value of eVar123 with contextData. All I had to do was add an "if" that said "if contextData exists". A very simple fix that was surprisingly overlooked by a lot of the people I work with. 😃 

Jennifer_Dungan
Community Advisor and Adobe Champion
May 10, 2023

Glad you got it sorted out!


Yeah... missing if statements can kill you! And they can be really easy to overlook too.