How to change visualization y-axis value to integer | Community
Skip to main content
Level 2
November 28, 2017
Solved

How to change visualization y-axis value to integer

  • November 28, 2017
  • 3 replies
  • 2128 views

Hi all,

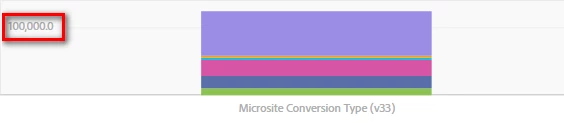
As you can see below chart. I don't know how to change value to integer.

anyone tell me how to fix. Thanks a lot.

This post is no longer active and is closed to new replies. Need help? Start a new post to ask your question.
Best answer by PratheepArunRaj

Dear Edison,

As per Adobe, it is a bug now in Visualization. They will fix it in the upcoming relase.

But your question paved an idea on the number format change on Graph Axis. I have submitted the same! Hope to get it incorporated soon.

Thank You!

Arun

3 replies

PratheepArunRaj
Community Advisor and Adobe Champion
November 29, 2017

Dear Edison,

That is the default option available right now. Hope you cannot change it!

Meanwhile I am exploring the option to change the same, if I get any answers, I will revert you back.

Thank You!

Arun

Thank You, Pratheep Arun Raj B (Arun) | Xerago | Terryn Winter Analytics
PratheepArunRaj
Community Advisor and Adobe Champion
PratheepArunRajCommunity Advisor and Adobe ChampionAccepted solution
Community Advisor and Adobe Champion
November 29, 2017

Dear Edison,

As per Adobe, it is a bug now in Visualization. They will fix it in the upcoming relase.

But your question paved an idea on the number format change on Graph Axis. I have submitted the same! Hope to get it incorporated soon.

Thank You!

Arun

Thank You, Pratheep Arun Raj B (Arun) | Xerago | Terryn Winter Analytics
Level 2
November 29, 2017

Hi Arun,

Thank you for helping, It is very good answer to me.

Your many responds are helpful to me in this forum, thank you for your sharing.