How is conversion measured in A/B testing? | Community
Skip to main content
Level 2
March 2, 2026
Solved

How is conversion measured in A/B testing?

  • March 2, 2026
  • 2 replies
  • 27 views

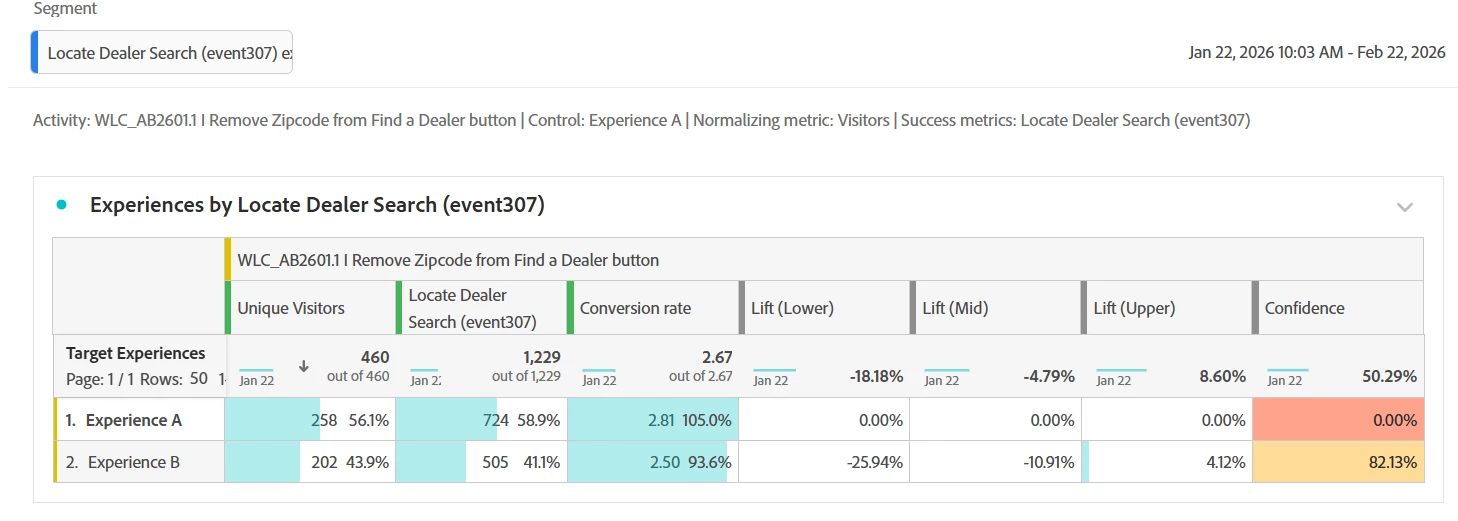
In the current A/B test (screenshot below), our team is perplexed as to why Experience B has the higher confidence rate while Experience A has the higher number of conversions. We are using Locate Dealer Search as our Segment, with our ultimate goal being the completion of a form on the dealer search page. 

Any input from experts on why/how conversions are measured? Did we structure the test correctly? 


Best answer by bjoern__koth

Hi ​@MeganHu3 

in the A/B test reporting, confidence (also called p-value) has nothing to do with success of an experience.
It just means that if you repeat the tests, the probability that you end up with the same results and that they were not caused by random chance is 1 - p-value.

in your case 82% means that if you are repeating your tests, the probability is 100-82 =18% chance that the results are reproducible, compared to your control group.

this has nothing to do with whether your test was successful and your variations performed better or worse.

that would be the "lift" metric you are seeing in your reports, which indicate that your test experience performs significantly worse than the control experience.

2 replies

bjoern__koth
Community Advisor and Adobe Champion
bjoern__kothCommunity Advisor and Adobe ChampionAccepted solution
Community Advisor and Adobe Champion
March 2, 2026

Hi ​@MeganHu3 

in the A/B test reporting, confidence (also called p-value) has nothing to do with success of an experience.
It just means that if you repeat the tests, the probability that you end up with the same results and that they were not caused by random chance is 1 - p-value.

in your case 82% means that if you are repeating your tests, the probability is 100-82 =18% chance that the results are reproducible, compared to your control group.

this has nothing to do with whether your test was successful and your variations performed better or worse.

that would be the "lift" metric you are seeing in your reports, which indicate that your test experience performs significantly worse than the control experience.

Cheers from Switzerland!
MeganHu3Author
Level 2
March 4, 2026

thanks so much for the helpful response!

MandyGeorge
Community Advisor and Adobe Champion
March 2, 2026

When you use Target for an A/B (or other multivariate) test, the control experience will always display a confidence level of 0. As ​@bjoern__koth said, the confidence doesn’t have to do with how good or bad the experience it, it’s related to the statistical significance. What the calculation is doing, essentially, is taking the conversion rate for that experience and comparing it to the conversion rate for the control experience. It then returns a confidence value to explain how confident you can be that the value is statistically significantly different than the control. A higher confidence value means that there is more evidence that there is an actual difference between that experience and the control. Whether that experience is better or worse, it doesn’t matter, it just calculates that it is different than the control. Because the control experience is being compared to itself, it’s always going to be the same value. So there is a 0% chance that the control is different than the control. Basically, ignore the confidence value on the control line.


So this means that when you’re reporting on an A/B test, you need to look at a couple things. The first is look at your lift. If your lift is positive that means that experience has done better than the control, if it’s negative that means the experience has done worse than the control (and of course the control will always be 0, because it’s being compared to itself). Next you look at the confidence. If it’s a high value, usually 90-95% that’s solid proof that the experience is different than the control. If it’s lower than that, it’s likely they’re different, but the evidence isn’t as strong. If it’s a very low number, then you can’t be confident that the two groups are actually different, regardless of the size of the lift. 

One of the things that will impact your confidence level is your sample size. You’ve got very small sample sizes there. Because you have such a large lift, it’s giving you a decent confidence value, but I would suggest trying to run the test for a bit longer to get a higher sample size so you can increase your confidence in the results of the test. 

MeganHu3Author
Level 2
March 4, 2026

thank you so much for your review and suggestions!