Solved
Free Form table Metric Comparison
- July 4, 2025
- 2 replies
- 593 views
Hi @martinpo3 ,
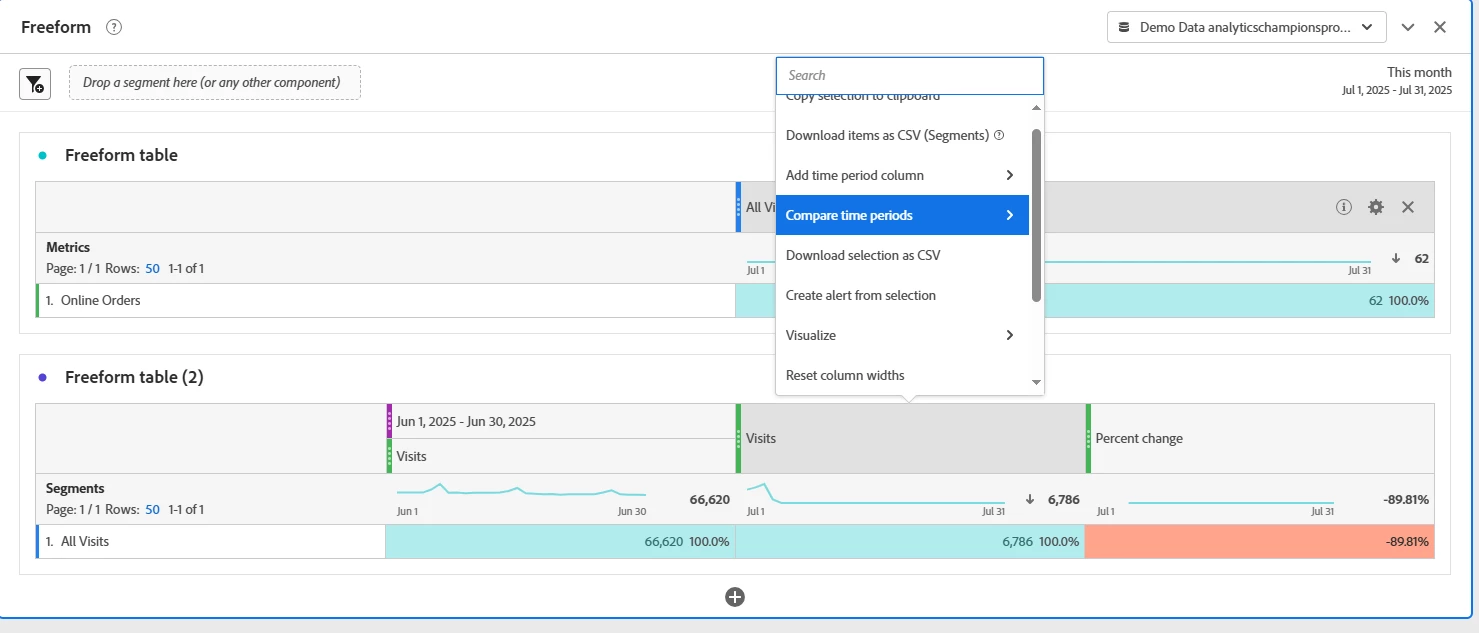
You can right click on the metric and use "Compare Time Periods" which will give you close to what you are looking for. One caveat, if you are using metrics the way you are creating table, it won't give you an option to Compare only Add. Also, it wouldn't work for calculated metrics.
More info on this - https://experienceleague.adobe.com/en/docs/analytics/analyze/analysis-workspace/components/calendar-date-ranges/time-comparison
Enter your E-mail address. We'll send you an e-mail with instructions to reset your password.