Solved
Filtering on the line chart
Hi, everybody!
I applied a filter, but the line chart didn't change.
For a bar chart, this works.
Tell me, please, what could be the matter?
Hi, everybody!
I applied a filter, but the line chart didn't change.
For a bar chart, this works.
Tell me, please, what could be the matter?
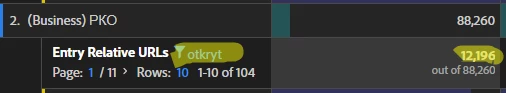
If your Line chart is based on the "2. (Business) PKO" row, then it won't change, because it's based on the "88,260" number.
Enter your E-mail address. We'll send you an e-mail with instructions to reset your password.