Fallout Analysis according to Category
Main Goal:
Determine how many visitors are viewing products, carting products, and purchasing products of each of our major shopping categories. Display this info as a fallout chart. All steps should be EVENTUAL PATH.
I'm trying to see visitor fallout rates over the following actions, according to shopping category. (Beauty, Jewelry, Electronics, etc.)
The numbers in () are strictly for example, but close to what I'd expect based on our business' history. We'll also use the Electronics category for instance.
- Electronics Page & Product Storefront Visitors (100%)
- Visitors that viewed an Electronics Product Page (90%)
- Visitors that added an Electronics Item to their cart (25%)
- Visitors that purchased an Electronics item ( 8%)
Originally, I tried creating a segment for each of the above steps, by Category. (About 30 different segments). That method didn't seem to work at all.
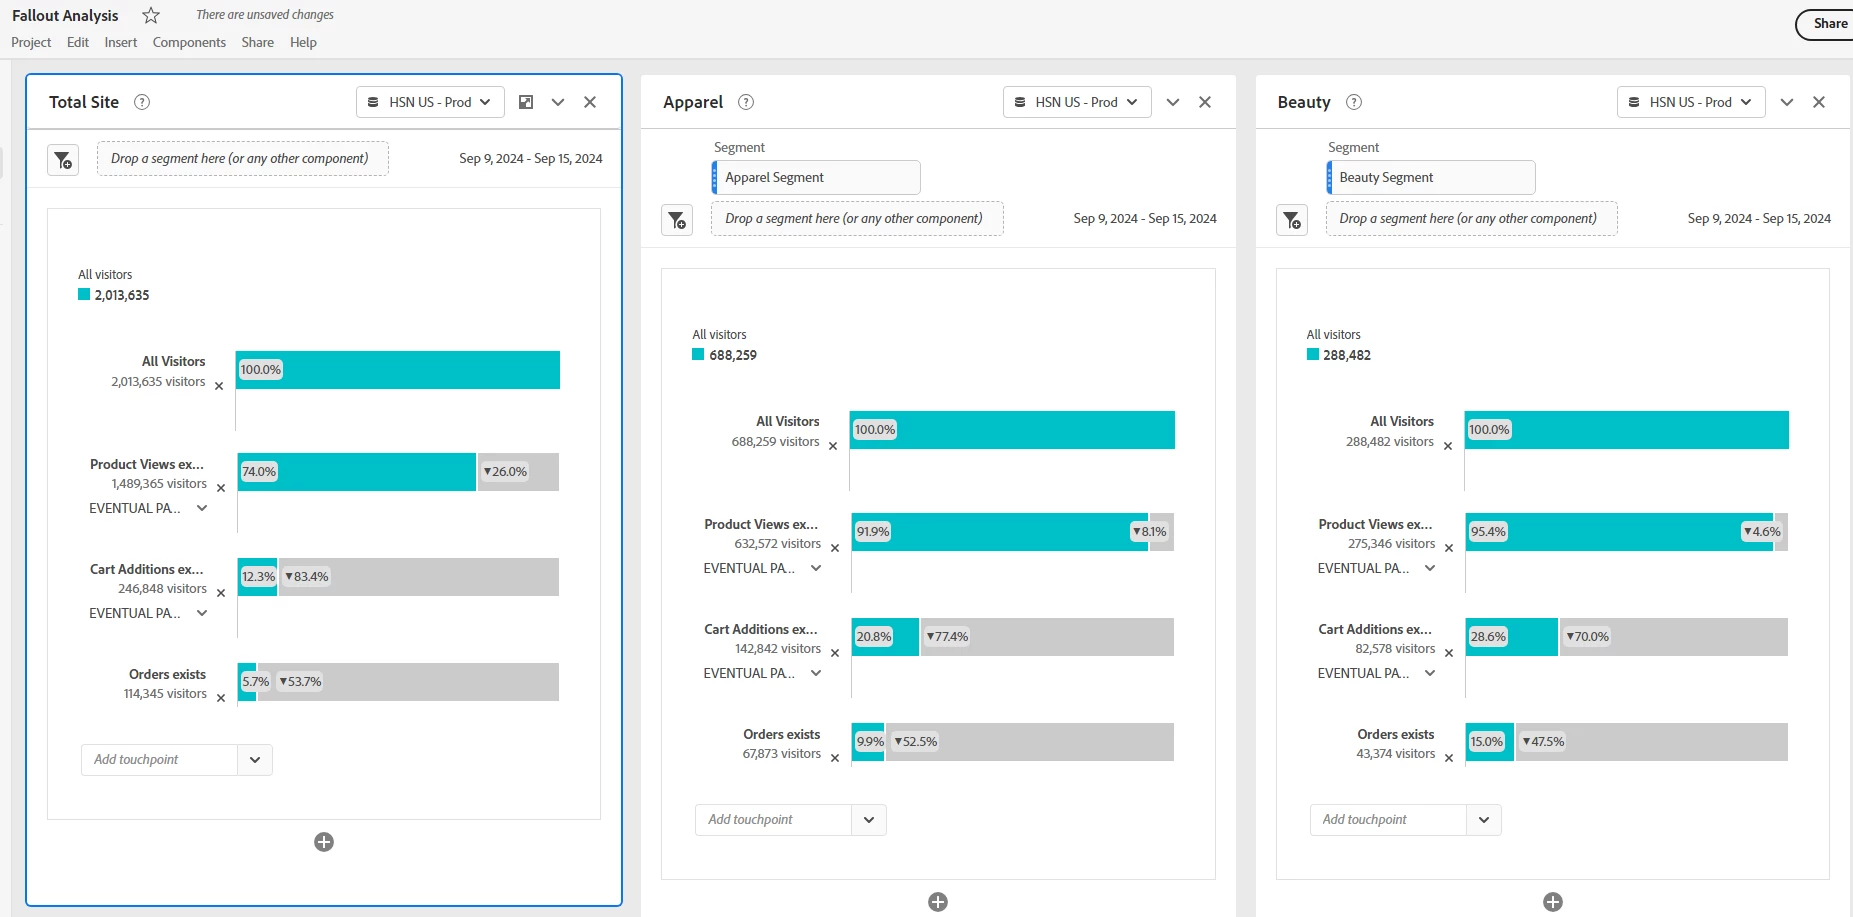
Currently, I'm using metrics (not segments) to define each step instead. Then I use a quick segment to build a fallout chart for each category. Metrics used:
- Total Visitors
- Product View (exists)
- Cart Addition (exists)
- Order (exists)
This method produces some more believable numbers, but I'm not sure it's exactly what I'm after in the main goal above. I feel maybe the first two steps are accurate, but cart addition would be considering products from ANY category, same for purchases. That's not what I'm after. I want to know fallout of visitors who viewed an Electronics product, carted an Electronics product, and purchased an Electronics product.
Is this possible?
-Brian
Current method results:
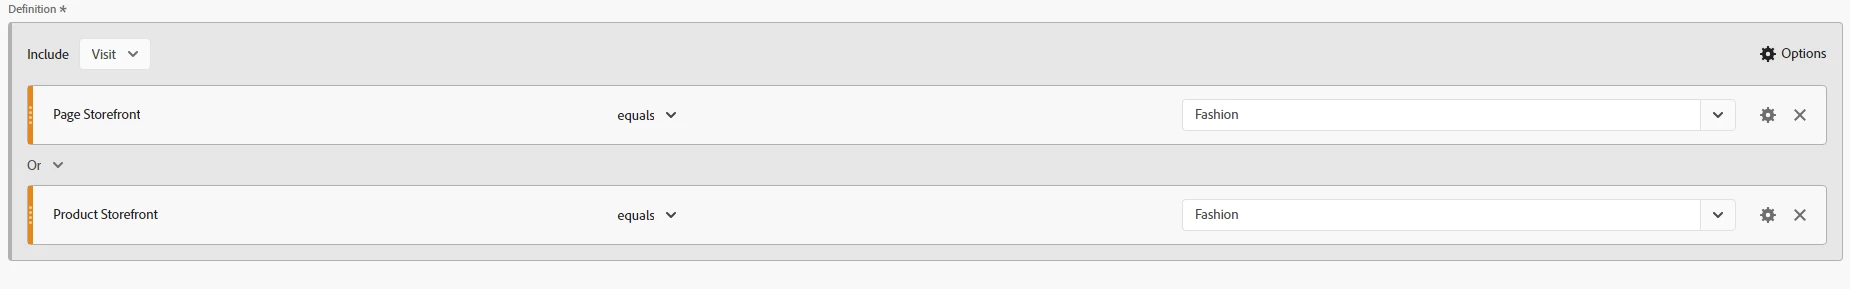
Example definition of a Quick Segment used: