Data in the first column change when I add a date range to the second column [Time Spent per Visit (seconds)] | Community
Skip to main content
kemalkilic
September 9, 2024
Question

Data in the first column change when I add a date range to the second column [Time Spent per Visit (seconds)]

  • September 9, 2024
  • 1 reply
  • 974 views

Hi Adobe Analytics community,


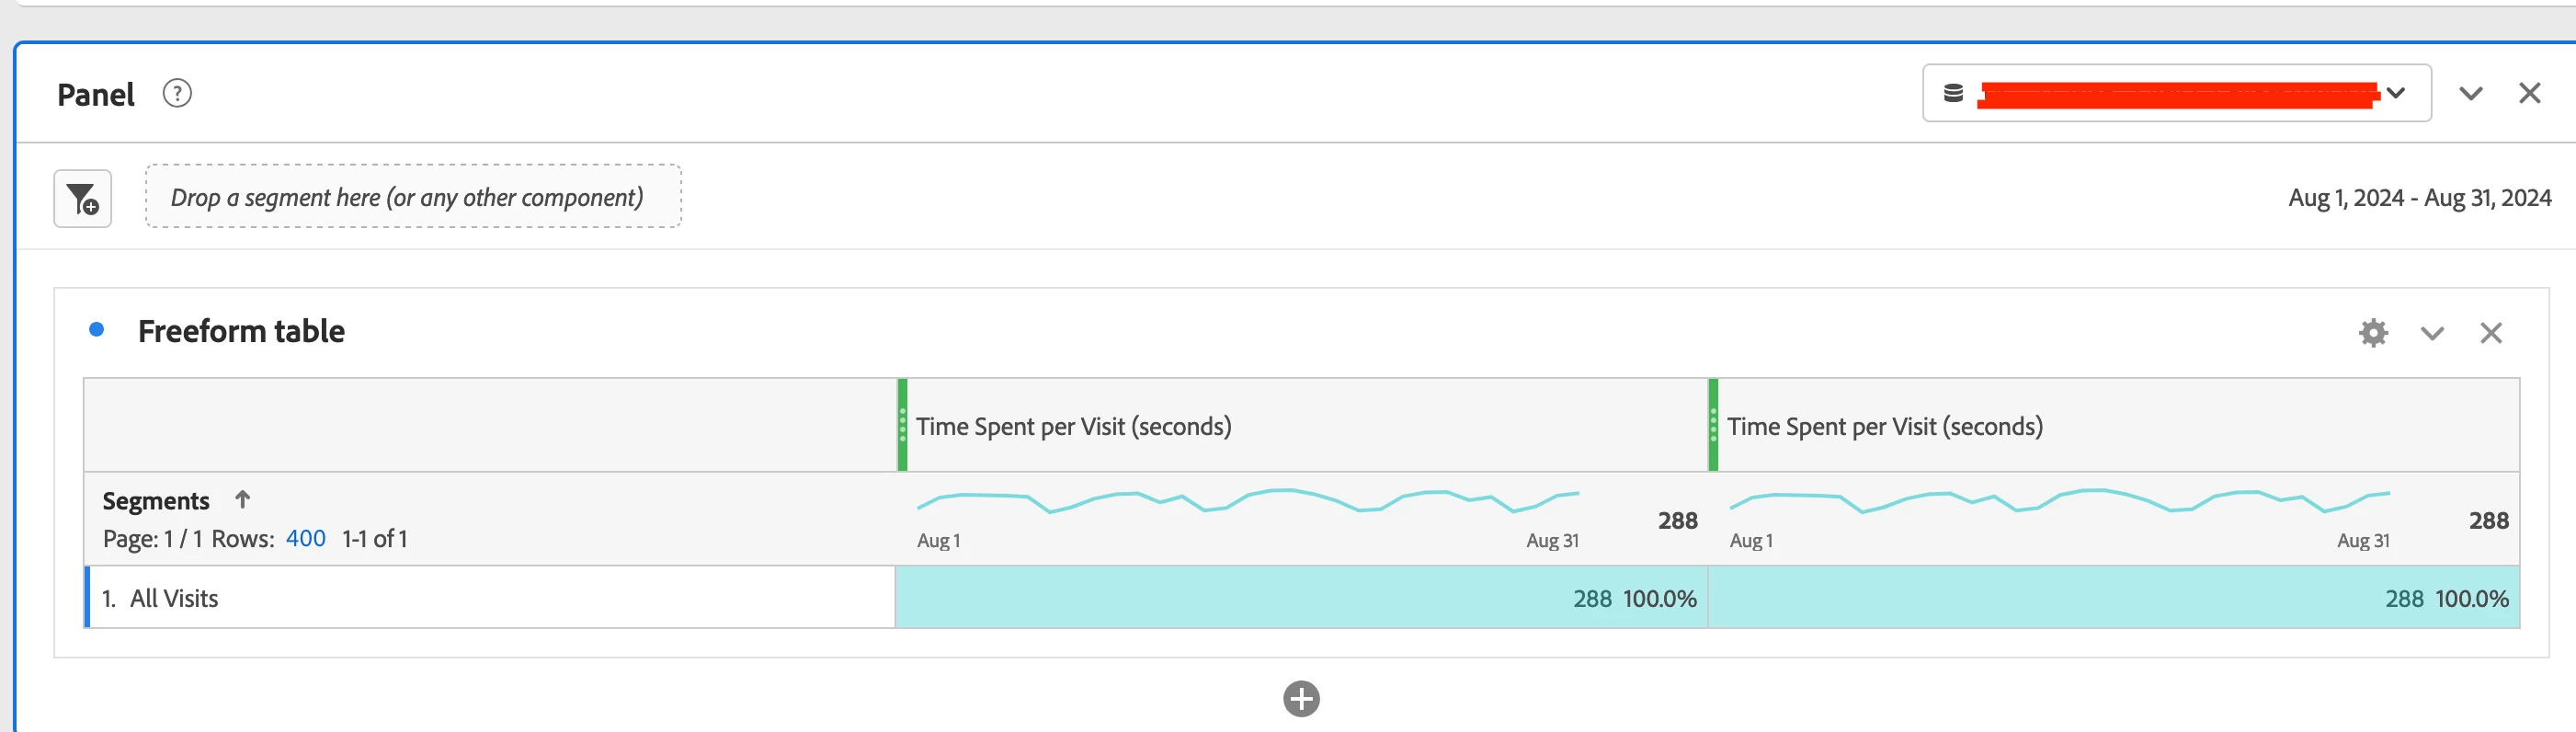
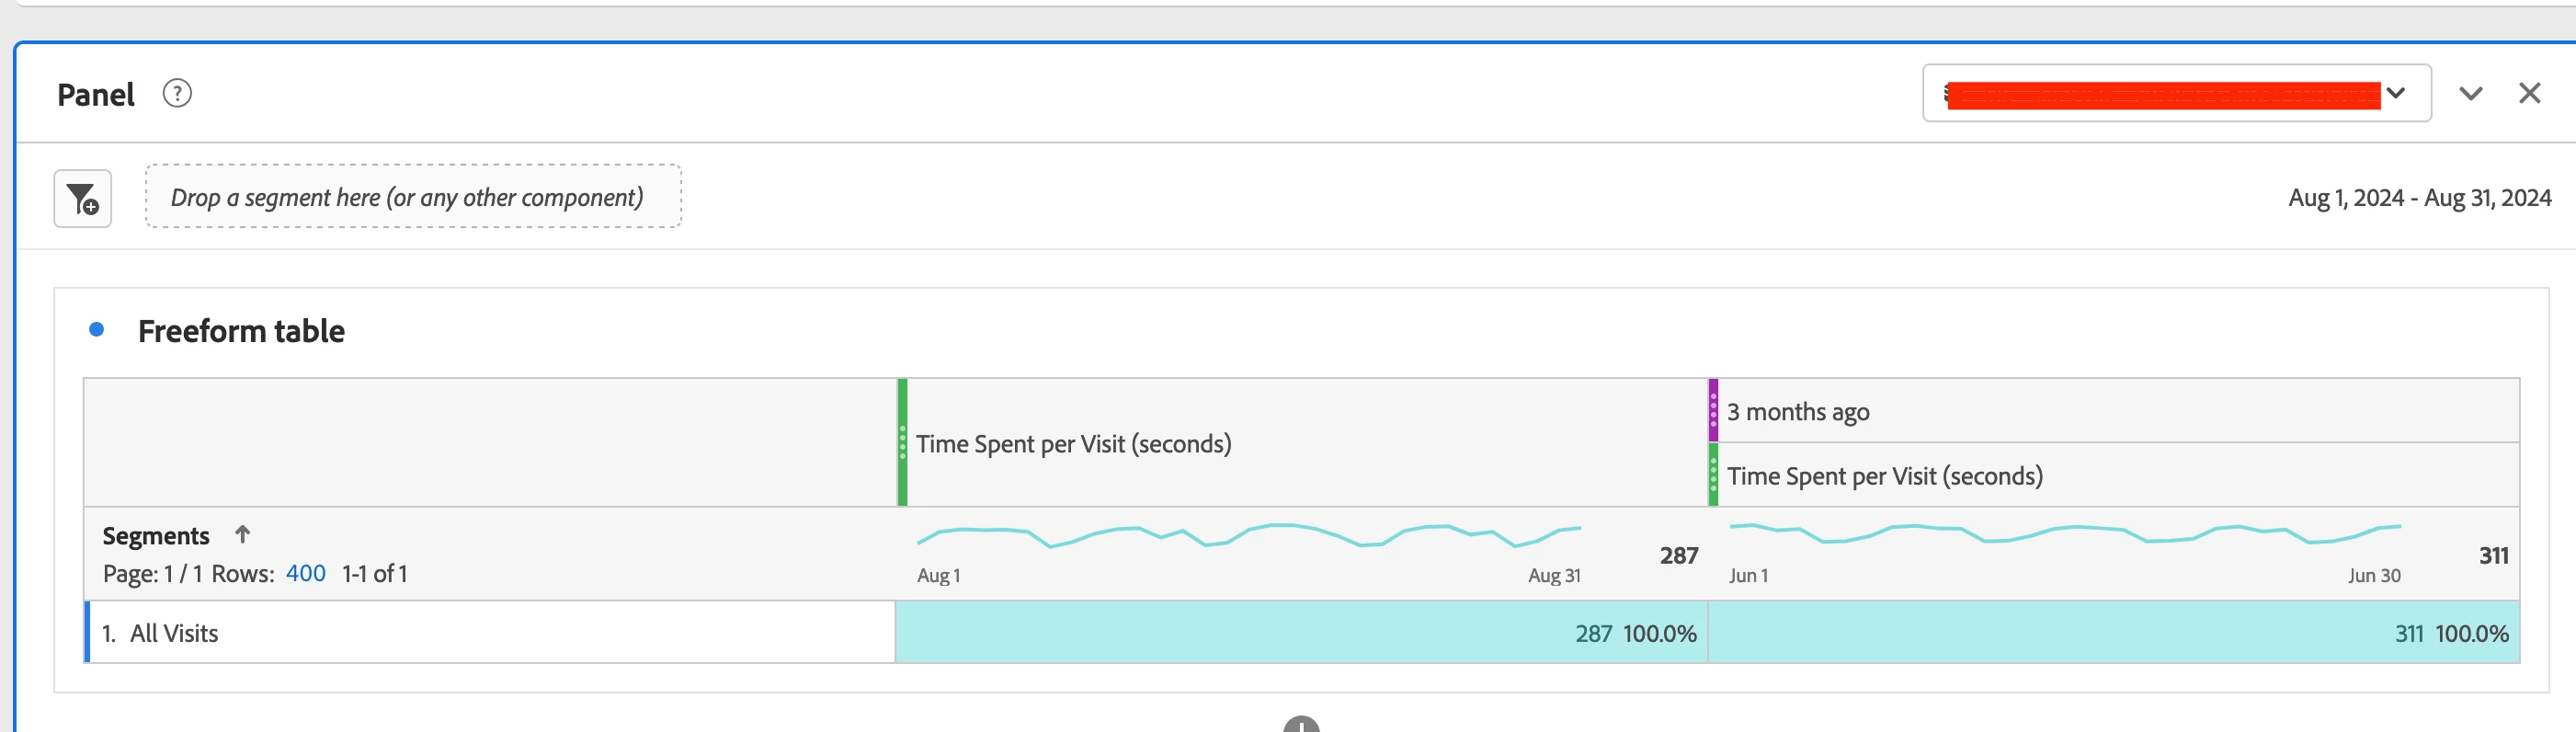
I am looking at the time spend per visit (seconds) metric last month and compare it with two months before. When I add the date range to the next column, the data in the first column change.


Please see first columns of freeform tables I attached. I would expect them to be identical but they are not. That looks quite unusual to me. In case you need it, I am selecting a virtual report suite and my visitors can be in different time zones.


Can anyone help me out? Thanks!


This post is no longer active and is closed to new replies. Need help? Start a new post to ask your question.

1 reply

bjoern__koth
Community Advisor and Adobe Champion
September 9, 2024

Hi @kemalkilic 

agree, this looks odd. If this is only a difference of 1, this may be due to some internal rounding.

As long as it does not show 5s, I would probably accept it as some internal data discrepancy.

Cheers from Switzerland!
kemalkilic
September 9, 2024

Hi @bjoern__koth,

Thanks for your reply.

In this example, the difference is only 1. However, I also have other cases where the difference is up to 5. I have a gut feeling that the difference is caused by time zone issue but I do not have a concrete argument for it.

bjoern__koth
Community Advisor and Adobe Champion
September 9, 2024

Yeah, could indeed be time zone related.

What if you break it down by Country?

Cheers from Switzerland!