Daily average based on an average metric | Community
Skip to main content
Level 2
November 8, 2024
Solved

Daily average based on an average metric

  • November 8, 2024
  • 3 replies
  • 2485 views

Hello


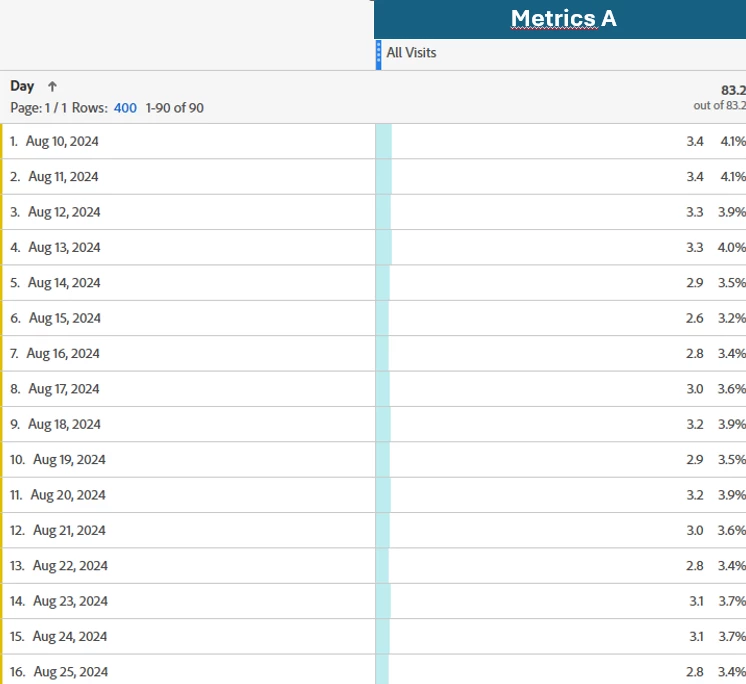
I have a metric that is an average per day: number of page views per unique visitor (metrics A in the screenshot). 


The date range is the last 90 days. Is it possible to have a daily average of this metrics A for the period of time please?

So here instead of getting 83.2 (sum(page views)/sum(unique visitors)) I would like to get a figure around 3 that is the sum(metrics A)/90.


Thanks in advance for your feedback. Have a good day


This post is no longer active and is closed to new replies. Need help? Start a new post to ask your question.
Best answer by Jennifer_Dungan

Why not just use the Mean function? If the data is already displayed by Day, the mean will automatically calculate the average daily value?


(Replace "Page Views" with the custom metric)


Now, this will end up with an entire column showing the average.... one of the tricks I do is to create a second table, with the mean calculation, then I use a Summary Number visualization in my report (hiding the second table)... I also then hide the "total" from the original table.


Deselect this on the duplicate table:


Hide the totals on the original table:


Display the Average in a separate visualization:


3 replies

SSampsa
Level 4
November 8, 2024

It would work something like this: Sum of Metric A divided by approximate count distinct for dimension Day.


Example:


Jennifer_Dungan
Community Advisor and Adobe Champion
Jennifer_DunganCommunity Advisor and Adobe ChampionAccepted solution
Community Advisor and Adobe Champion
November 8, 2024

Why not just use the Mean function? If the data is already displayed by Day, the mean will automatically calculate the average daily value?


(Replace "Page Views" with the custom metric)


Now, this will end up with an entire column showing the average.... one of the tricks I do is to create a second table, with the mean calculation, then I use a Summary Number visualization in my report (hiding the second table)... I also then hide the "total" from the original table.


Deselect this on the duplicate table:


Hide the totals on the original table:


Display the Average in a separate visualization:


MandyGeorge
Community Advisor and Adobe Champion
November 8, 2024

I agree with @jennifer_dungan, the mean function is exactly what I would do. The only thing I might suggest differently is the Median function instead, depending on what your data looks like. But generally, either of the measures of central tendency (mean or median) are going to be the simplest way to get what you want.

Isha Gupta
Community Advisor and Adobe Champion
November 8, 2024

Hi @sophie_h ,

Let me try this one. Will a setup like below solve your use case?


Best,

Isha

Nick_Walter
Community Advisor and Adobe Champion
November 8, 2024

If you are asking to change the column summary number to be average rather than total, no. there currently is not a way to change that. You can go into preferences to adjust the summary number but it will always be a sum total. To get your daily average you will need a calculated metric and pull that into a table.

Jennifer_Dungan
Community Advisor and Adobe Champion
November 8, 2024

Yeah, it's sometimes a little random... if the metric is a calculated metric, like Page Views / Visits... then you often get the average in the column total... but other times, it gives you a total... I haven't fully figured out what logic is used to determine what behaviour is chosen... but as @nick_walter said, there is no way to change the behaviour manually.... 


I wish there was, that would make our lives easier... that on the column settings, where you can choose to show or hide totals, I wish there was an option for "total" or "average"... 

Level 1
November 21, 2024

hi @nick_walter and @jennifer_dungan 


Is this something that can be requested as a feature for future releases?


I'm running into a similar issue where I want to see a weekly average of a custom metric for a longer time period, for example Month or Quarter.


I am trying to get Visits Per Visitor but that metric at the weekly level, which is usually around 3-4, is more important to us than the monthly or quarterly level which is showing double or triple those values in our tables. The "total" at the top of the column is not very helpful when we are looking for an average.


In my screenshot is an example of the issue.