New
Change the % chart option in workspace to relate to the % of total that appears in the rows!
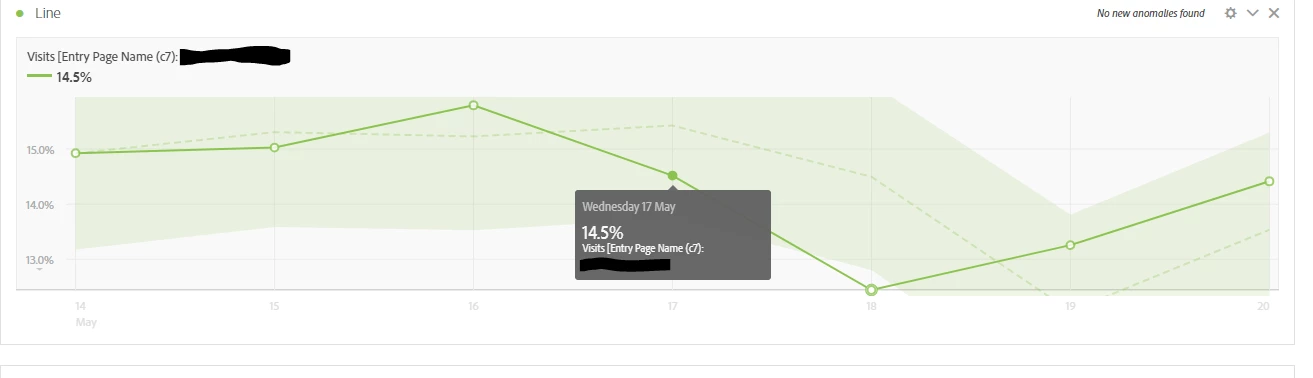
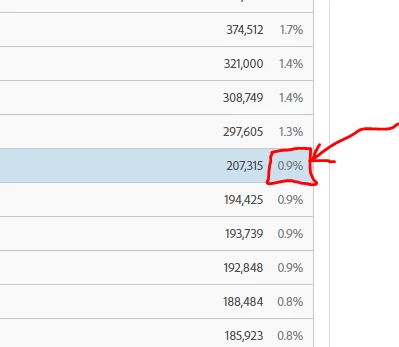
Currently, when clicking the 'show %' option in a chart in workspace gives the overall % of the metric over the time period, which is next to useless analytically and waaaaaay less commonly used than the alternative - i.e. the % that appears in the column as a the respective dimension value's % of total values.
It would be much more intuitive and useful if the 'show percentages' option showed the dimension value's % of total for each day / week instead.