Solved
Average Monthly Unique Visitors by Channel
Hello!
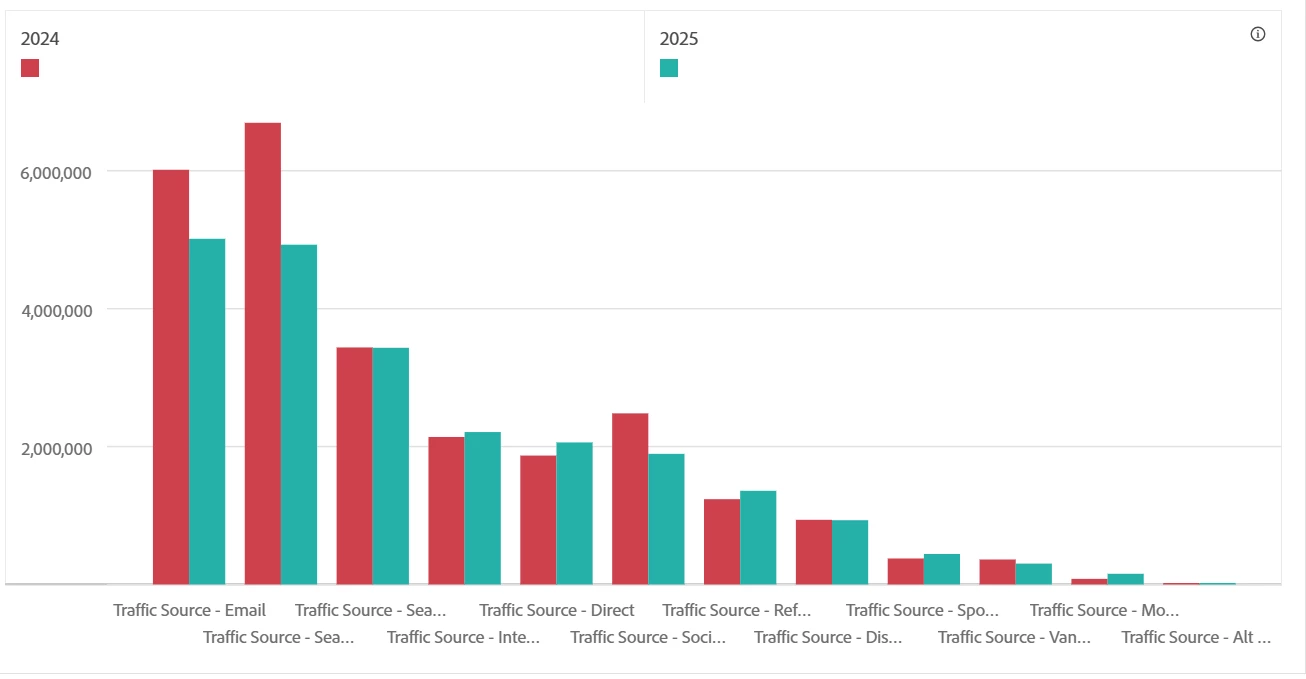
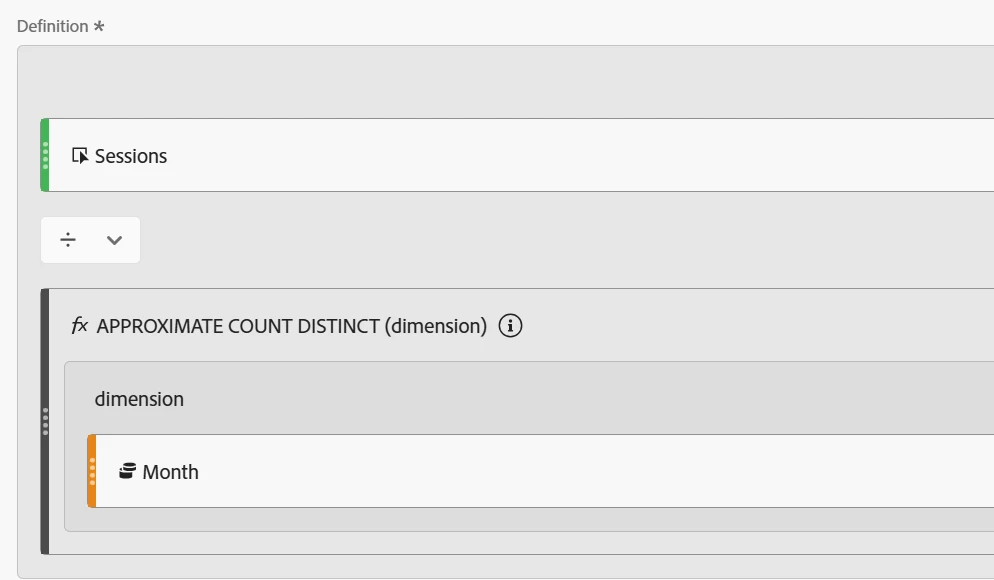
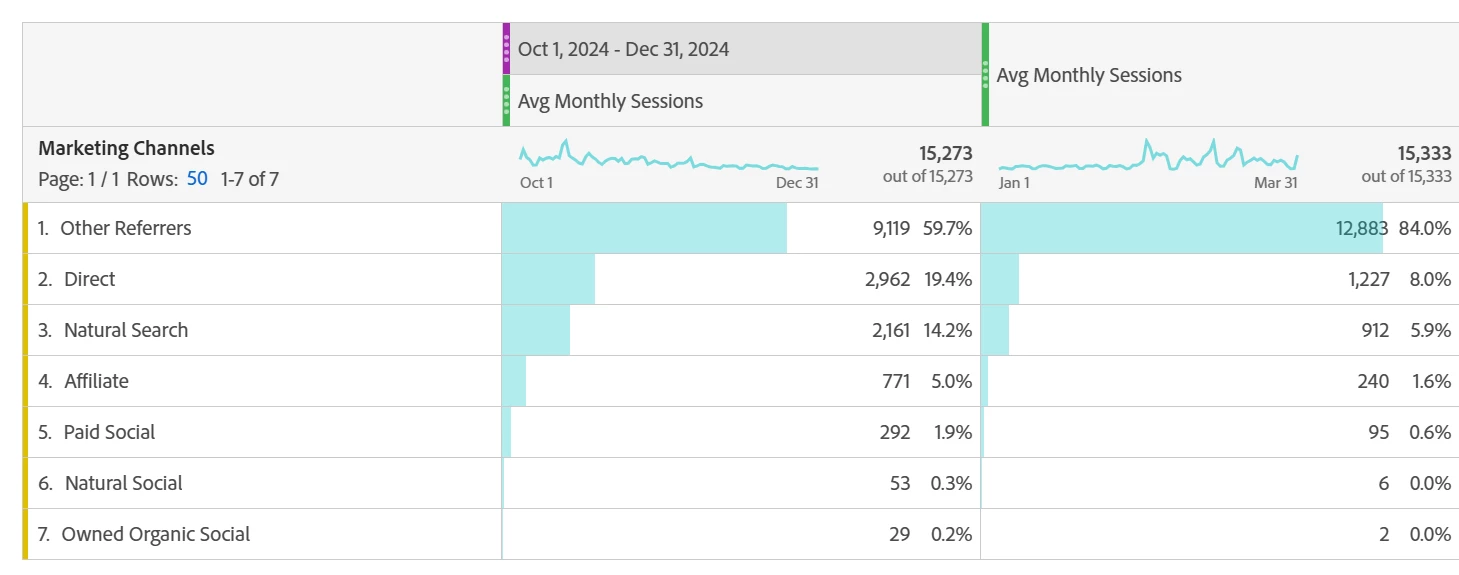
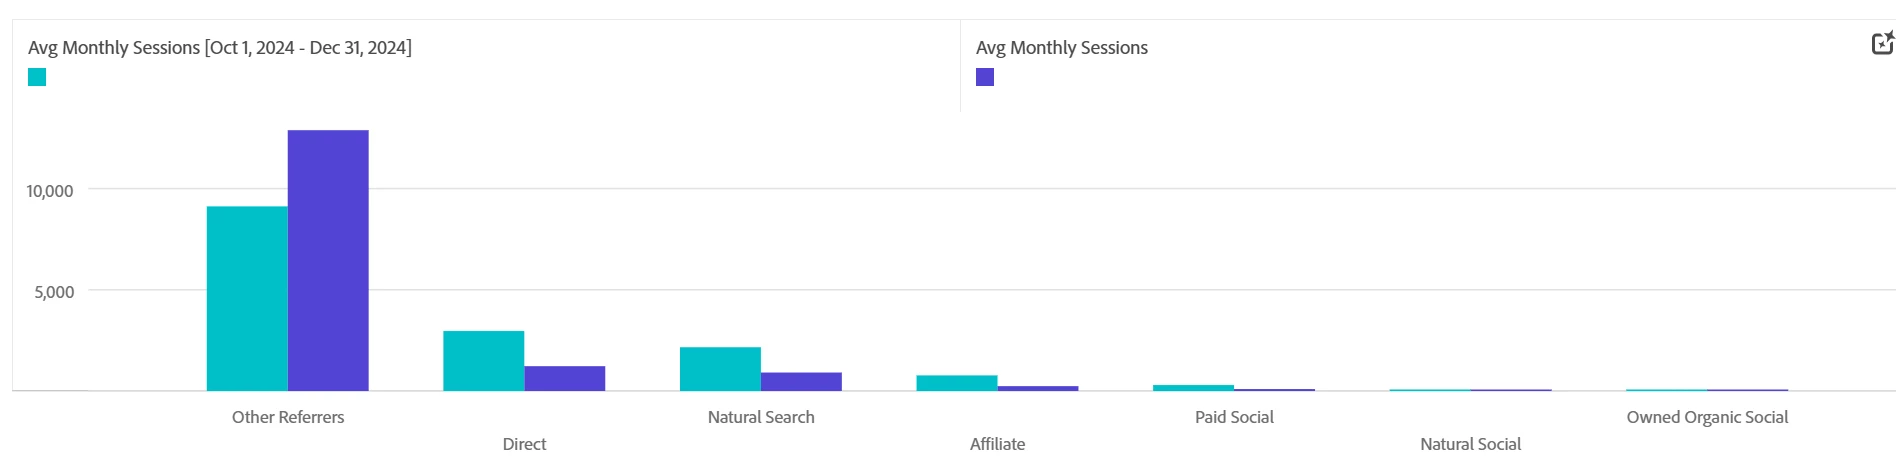
This is a follow up to a previous post that I made re: average monthly unique visitors. I used Josh Stephens solution of the Column mean function to find average monthly unique visitors using the Month dimension. However, I have been asked to compare average monthly unique visitors by channel with a YoY comparison while putting it in a graph (that will hopefully look like the below screenshot). I am having issues with this because it is difficult to have the month dimension in a table that compares the three months of Q1 of 2024 and Q1 of 2025 with the different channels and calculating a mean for all of those functions in a neat and understandable way. I hope this makes sense!