Adobe rules are firing but the data is not coming into the Platform Debugger | Adobe Higher Education
Skip to main content
Level 3
September 21, 2023
Respondido

Adobe rules are firing but the data is not coming into the Platform Debugger

  • September 21, 2023
  • 2 respostas
  • 2712 Visualizações

As the title states, there are two specific Adobe rules (one is triggered via custom event and the other is triggered by a CSS entering viewport) that are firing but the data is not getting into the debugger. 


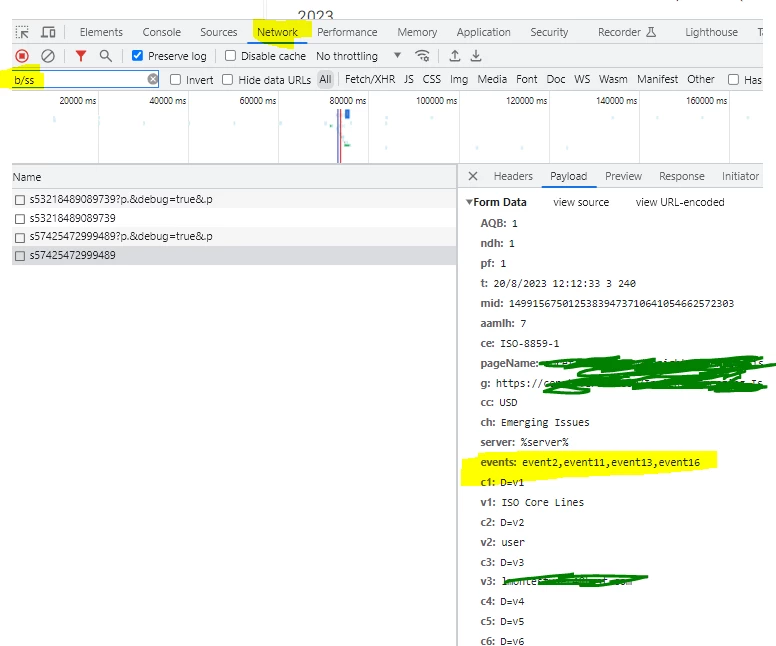
In the browser's network tab, I see that all the variables are being captured. 


However, the timing tab indicates that this is being "stalled" when I compared it to the server call of a rule that is getting captured. 

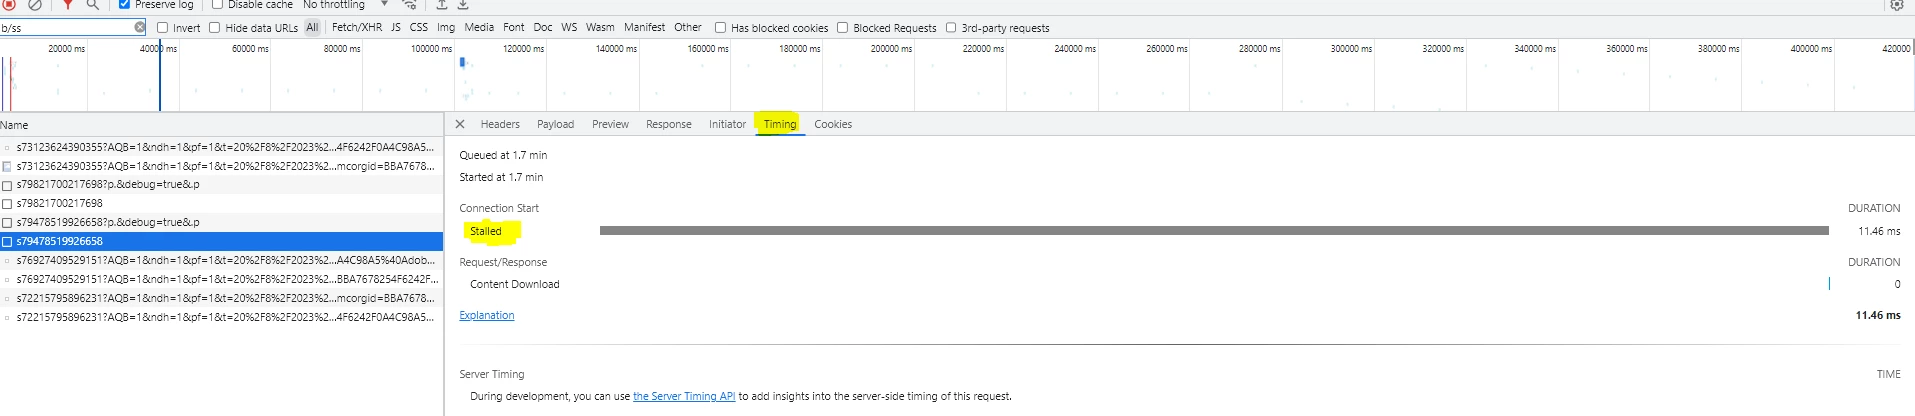
I have checked Chrome's definitions of what that means - but I am not able to pin anything down. 


Este tópico foi fechado para respostas.
Melhor resposta por Jennifer_Dungan

Hmm, I've not seen this... have you checked that the actual server you are sending the requests to is responding?


I can't see that in your screenshots, so I don't know if you are using one of the default Adobe third party servers, or if you have set up a custom first party tracking server:


i.e. your site is www.domain.com  and your tracking server is s.domain.com


If you try to load your tracking server directly (either by typing in s.domain.com, or if you copy the actual tracking request and try to load it directly does it complete?


If it doesn't you may need to reach out to Client Care (if using the Adobe default server, make sure that there isn't an issue... if using your own server, confirm with them that the server has properly been configured)


If this is a very new implementation, maybe the DNS hasn't yet propagated.

2 Respostas

Jennifer_Dungan
Community Advisor and Adobe Champion
September 21, 2023

Hmm, I've not seen this... have you checked that the actual server you are sending the requests to is responding?


I can't see that in your screenshots, so I don't know if you are using one of the default Adobe third party servers, or if you have set up a custom first party tracking server:


i.e. your site is www.domain.com  and your tracking server is s.domain.com


If you try to load your tracking server directly (either by typing in s.domain.com, or if you copy the actual tracking request and try to load it directly does it complete?


If it doesn't you may need to reach out to Client Care (if using the Adobe default server, make sure that there isn't an issue... if using your own server, confirm with them that the server has properly been configured)


If this is a very new implementation, maybe the DNS hasn't yet propagated.

Level 3
September 21, 2023

Thank you for your response. 


We can rule a few things out based on what you asked to confirm.


1) There are other rules that are based on the same custom events that are tracked and the data is flowing to the debugger without issues. 

2) All the server domains are the same so if one is working the other should* work as well. 

leocwlau
Community Advisor and Adobe Champion
September 21, 2023

What's the response to that network call, do you have a "200"?

Level 3
September 21, 2023

The status are all 200. 


Jennifer_Dungan
Community Advisor and Adobe Champion
September 21, 2023

Actually, I just checked ours.. I am also seeing "stalled".


I think this is something that the "man-in-the-middle" debugger tool is doing... I don't think it's actually impacting the tracking.


But my data is showing in the debugger... 


Can I ask, is the debugger not showing anything? Or just that a lot of the custom dimensions are missing in what does show in the debugger?


I've been noticing the second issue on and off for the last few weeks.. I believe there is a bug in the extension, as I can see all the data in the network call and in Omnibug...