Adding Data Label in Visualizations | Community
Skip to main content
SrividyaVenkat
Level 3
April 3, 2023
Solved

Adding Data Label in Visualizations

  • April 3, 2023
  • 2 replies
  • 1485 views

Hi All,


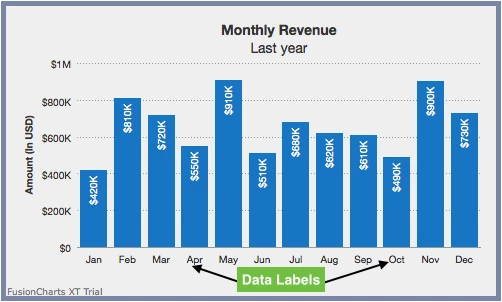
Are there any way to add data values as labels like in excel in Bar graphs.


Refer the image below.


As well increase the numbers of series (refer the screenshot below)
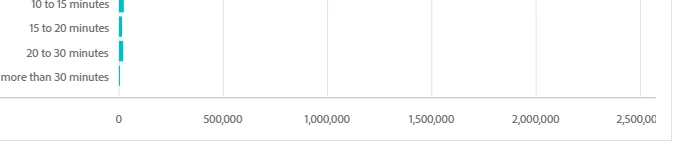
 

This post is no longer active and is closed to new replies. Need help? Start a new post to ask your question.
Best answer by Krishna_Musku

Combo visualizations will also give more insights, but it is a comparison viz.

2 replies

Level 2
April 3, 2023

No - these are lifted fro your freeform table to which the visualisation is based. So I would encourage good variable naming or alternatively to use segments/calc metrics with good labelling. For call-outs on the visual I would recommend checking out Annotations.

Krishna_Musku
Community Advisor and Adobe Champion
Krishna_MuskuCommunity Advisor and Adobe ChampionAccepted solution
Community Advisor and Adobe Champion
April 3, 2023

Combo visualizations will also give more insights, but it is a comparison viz.

- Krishna Musku (Adobe Champion & Community Advisor)