Ability to manually group rows of data in Analysis Workspace
I think it would be super-cool if users could use SHIFT or CTRL to select rows in Analysis Workspace and temporarily see them grouped together and with metrics for the grouped rows summed. Today, you have to leave what you are doing and either build a segment or create a SAINT Classification. This stops the flow of doing analysis.
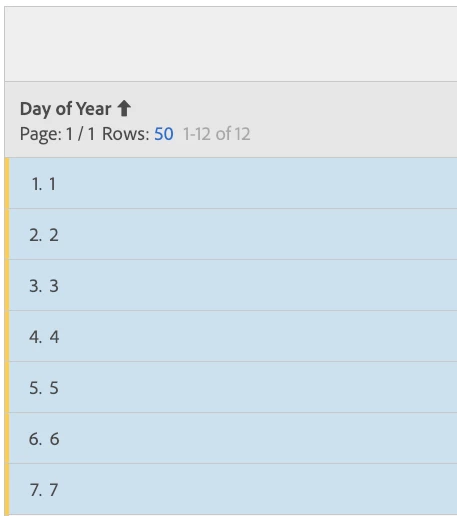
For example, let's say that I am looking at a Freeform Table with Day of Year as the dimension. What if I wanted to group the first 7 rows and see the data aggregated. It would be great if I could select the rows and then right-click to open a new table that has those rows summed.
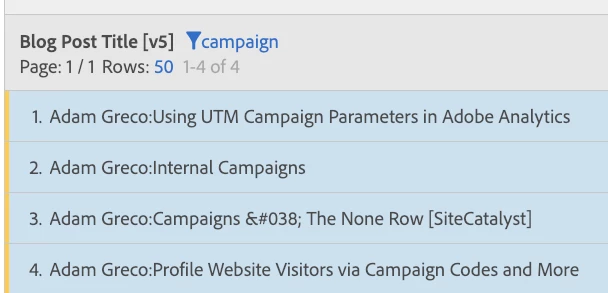
As another example, what if I were looking at a set of blog posts (or pages) and I randomly wanted to search for the ones that include the word "campaign" (shown below) and see all of that aggregated into one row:
In the future, it would be cool if these ad-hoc (no pun intended!) selections could be saved, shared and turned into segments...Better yet would be a way to create these aggregations using search criteria expressions and/or RegEx...