晨光赵56058932
December 1, 2019
Solved

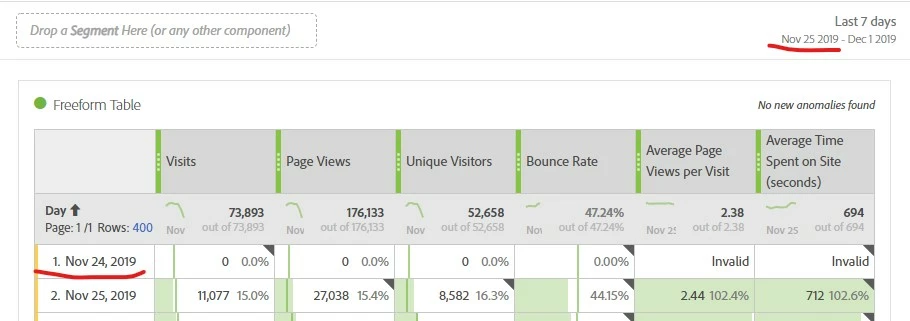
A blank line always shows in the report out of time range because of bounce rate metrics

When I choose the bounce rate metrics, a blank line always shows in the report and out of the selected time range. How can I fix this in the report?
This post is no longer active and is closed to new replies. Need help? Start a new post to ask your question.
Hyder_Ziaee
Hyder_ZiaeeAccepted solution
Adobe Employee
December 2, 2019

Bounce rate is calculated based on Bounces/Entries. Since the visit can span over two days, with the entry on the previous day (24th), you will see the extra line show up.

You can add bounces and Entries to the table to see how bounce rate is calculated and how many entries are on the previous day

3 replies

Asheesh_Pandey
Adobe Champion and Community Advisor
December 1, 2019

you should be able to fix it via column settings. To access Column Settings, drag a Freeform Table to the project, then click the gear icon in the column heading. Column settings

To fix - Enable Interpret zero as no value - Determines for cells with a 0 value, determines whether to show a 0 or a blank cell.

Translate
- Asheesh
晨光赵56058932
December 1, 2019

Why the Nov 24 data come out in the report from Nov 25 to Dec 1 report?

Translate
Hyder_Ziaee
Adobe Employee
Hyder_ZiaeeAdobe EmployeeAccepted solution
Adobe Employee
December 2, 2019

Bounce rate is calculated based on Bounces/Entries. Since the visit can span over two days, with the entry on the previous day (24th), you will see the extra line show up.

You can add bounces and Entries to the table to see how bounce rate is calculated and how many entries are on the previous day

Translate