Expand my Community achievements bar.

Join us for the next Community Q&A Coffee Break on Tuesday April 23, 2024 with Eric Matisoff, Principal Evangelist, Analytics & Data Science, who will join us to discuss all the big news and announcements from Summit 2024!
SOLVED

Normalization greyed out?

Avatar

Level 2

I was trying to replicate something similar to Justin Grovers post on content blocking for iOS 9 traffic, but I can't seem to get the normalization option to be in a selectable state (greyed out).  Any ideas to what I'm doing wrong?


https://blogs.adobe.com/digitalmarketing/analytics/assessing-the-impact-of-ios-9-content-b locking-with-adobe-analytics/

1 Accepted Solution

Avatar

Correct answer by
Level 10

Hi Grant,

When you drag and drop the line graph on the freeform panel, click on the gear icon while the graph is still empty and then check the Normalization option. Then go ahead and select the data to be displayed.

Let me know if that works for you.

View solution in original post

7 Replies

Avatar

Level 10

Hi Grant, 

Welcome to the Adobe Analytics Community!

Well the normalization option is greyed out because essentially your graph contains the view on one dimension only (occurence) with two different segments. So the scale of the number remains the same. Normalization works when you are comparing numbers being measured in different quantities. For example, if you are displaying Visits and Unique visitors in the same graph you can normalize because those are different dimensions/metrics.

I hope his clears your doubt, let me know if you have further questions. Thanks!

Tanmay

Avatar

Level 2

Thanks Tanmay.  So how is Justin able to do this in his report? From what I can see, I’m using a very similar setup as him (attaching screenshot of his analysis).


Avatar

Level 2

Also, as you suggested, I tried 2 different metrics - Visits vs Unique Visitors and I still am not able to normalize (see screenshot).

Avatar

Level 10

Hi Grant,

I did some more research on the Normalization function and found out it works a little differently in Analytics as compared to the usual way. There are some caveats and workarounds. 

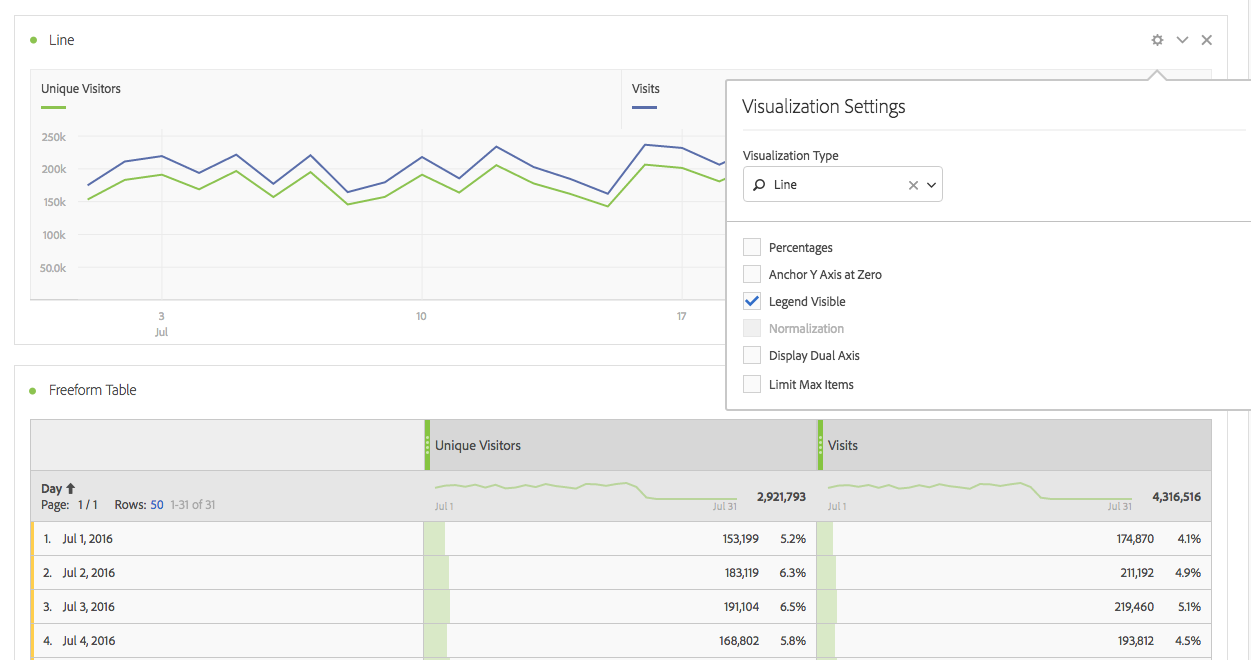
Normalization works if it is the same metric and you are comparing different date ranges for the same metric or same metric with different segments applied. You would need to pull "day" as dimension for it to work. (That is you have to trend the report).

Also, there is a glitch. If I get normalization enabled and then add metrics, it will still be enabled. Similarly, if the normalization is disabled due to multiple metrics and then I remove to have only one, it will still be disabled.

Could you try it again at your end now?

Tanmay

Avatar

Level 2

Hi Tanmay, thanks for your research in this issue.  Can you post a screenshot of how you were able to work around this glitch?  I can’t seem to replicate your success.


For example, how do I trend 2 different date ranges with a single metrics when Day is the dimension?

Avatar

Correct answer by
Level 10

Hi Grant,

When you drag and drop the line graph on the freeform panel, click on the gear icon while the graph is still empty and then check the Normalization option. Then go ahead and select the data to be displayed.

Let me know if that works for you.

Avatar

Level 2

Yes, that worked!  Thank you so much for staying with me on this issue.