Performance Timing Plugin
- Mark as New
- Follow
- Mute
- Subscribe to RSS Feed
- Permalink
- Report
are the numbers for the events for the performance timing plugin in seconds or milliseconds? How should I read this?
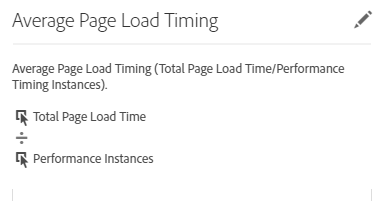
the first page (previous page) had an average Page Load TIme of 4 seconds or is that 4 milliseconds?
Also, should the events be counters or numeric or some of both?
right now I have:
*event57: Redirect Timing - Counter
*event58: App Cache Timing - Counter
*event59: DNS Timing - Counter
*event60: TCP Timing - Counter
*event61: Request Timing - Counter
*event62: Response Timing - Counter
*event63: Procesing Timing - Counter
*event64: onload Timing - Counter
*event65: Total Page Load Time - Counter
*event66: Performance Instances - Counter
it didn't say anything here about ms or seconds: performanceTiming
Solved! Go to Solution.
- Mark as New
- Follow
- Mute
- Subscribe to RSS Feed
- Permalink
- Report
The navigation timing interface link mentioned in "Performance Timing Plugin" says the time is being measured in milliseconds. Not sure if it makes sense or not in your case.
Please let me know if you find out anything else on this for knowledge purpose.
Regards,
Saurabh Kumar.
- Mark as New
- Follow
- Mute
- Subscribe to RSS Feed
- Permalink
- Report
The events (apart from Performance Instances) must be configured as "Numeric".
The values captured are in seconds.
Any invalid values (i.e. negative timings or timings that exceed the limit of 600 seconds) are recorded as 600 seconds.
- Mark as New
- Follow
- Mute
- Subscribe to RSS Feed
- Permalink
- Report
Thanks BarryLennon for pointing out the event Types! this should really be stated on the adobe site.
Quick question, would recommend configuring the events Types to 'No Subrelations'? I only ask per Adobe official recommendation states "In almost every case, you should choose the event type that does not have the "No Subrelations" condition (Chapter 11-8).
Thanks again for pointing this out!
Views
Replies
Total Likes


